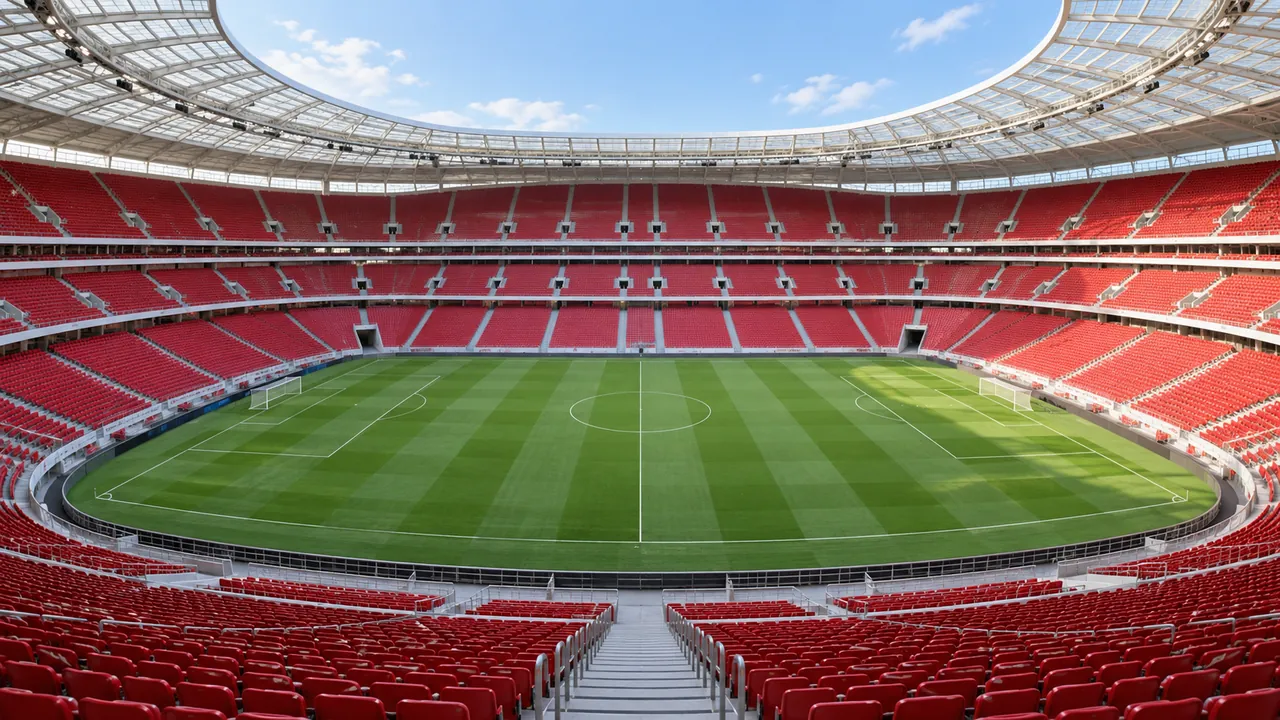
Premier League 2026/27: Tabelle, Spielplan und Ergebnisse. 20 Teams.
We hold 6,460 Premier League matches, with results from 2010 to 2026.
Teams in the 2026/27 Premier League: 20 teams. From 2010/11 to 2026/27 we hold 6,460 matches, 6,140 matches of which have a final result, across 17 seasons.
The first match in our records for this competition was played on 14 August 2010, and the latest finished one on 12 October 2026.
After 6 matches in 2026/27, first place is held by Man City with 18 points. Second-placed Arsenal are 3 points behind. Fourth place belongs to Brentford with 10 points, while Sunderland are 17th with 4 points. Last place is occupied by Fulham, on 2 points. The latest round, matchday 6, ended on 12 October 2026 with 10 matches finished and 36 goals in total.
In the 2025/26 season, 380 matches produced 1,045 goals, an average of 2.8 per match. The split by result: home wins 43%, draws 27%, away wins 30%. In 44% of the matches, at least one side did not concede. Arsenal beat Leeds United 5-0 on 23 August 2025, the biggest home win of the season. No match had more goals than Fulham 4-5 Man City, played on 2 December 2025, with 9 goals. Across all 6,140 matches finished in our records, the average is 2.8 goals per match.
Goals per match by side: 1.6 for the home team, 1.2 for the visitors.
Season by season, the goals-per-match average read 2.7 in 2020/21, 2.8 in 2021/22, 2.9 in 2022/23, 3.3 in 2023/24, 2.9 in 2024/25 and 2.8 in 2025/26. Among complete seasons, 2023/24 scored the most goals per match (3.3) and 2014/15 the fewest (2.6).
No single match stands alone for the widest result; the margin is 9 goals. More than one match holds the record for goals, 10 goals in all. In every finished match we hold, the results read: home wins 45%, draws 24%, away wins 31%.
Away from home, the largest win in our records is Southampton 0-9 Leicester City, played on 25 October 2019.
One goal settled 37% of the matches we hold, while 7% finished 0-0.
Matches with four or more goals make up 31% of the finished matches in our records.
17% of finished matches ended with a gap of at least three goals.
A clean sheet came for the home side in 31% of the matches we hold and for the visitors in 23%.
Erling Haaland (Man City) headed the 2025/26 scoring list on 27 goals, adding 8 assists in 36 appearances. In the 2026/27 edition so far, Erling Haaland of Man City leads the list with 6 goals.
All table and current-season figures on this page are as of 14 October 2026.
Harry Kane has the highest goal total in our scorer lists, 210 goals over 9 seasons, out of 17 seasons of lists.
Going by the results we hold, the table winners of the last five completed seasons were Arsenal (2025/26, 85 points), Liverpool (2024/25, 84 points), Man City (2023/24, 91 points), Man City (2022/23, 89 points) and Man City (2021/22, 93 points). No club reached more points in a single season of our records than Man City in 2017/18, with 100 points. Man City finished first most often in the seasons covered, 8 times out of 16 seasons.
Wins in our records are led by Man City with 417 wins, then Arsenal with 349 wins and Liverpool with 347 wins. The highest goal total by a single side is 1,395 goals, by Man City. Level at the top of the matches-played count: 7 teams, with 614 matches each.
Liverpool went 44 matches without losing between 12 January 2019 and 24 February 2020, the longest such run we hold.
Liverpool and Man City share the longest winning run in our records, 18 matches in a row each.
Man City hold the best home record in our data, with 237 wins from 307 matches at home.
The busiest-day mark in the record, 10 matches, belongs to more than one date.
The year with the most results in the data is 2023: 412 matches.
Over the full record, our match data for this competition covers 42 teams.
Most goals in a draw: West Brom 5-5 Man United, played on 19 May 2013.
Winning margin on average: 1.9 goals.
Saturday and Sunday matches: 77% of the finished matches we hold.
Everton have the most draws in our records, 178 draws.